



Estimating What Follows the Mammogram: A Transparent Model of Breast Imaging Downstream Revenue
Richard D. Lippert, Jr.
Founder, President, and Chief Executive Auditor, Mammologix · Breast Imaging Operations since 1995
A screening mammogram begins a pathway, not ends one. The Downstream Revenue Estimator by Mammologix models the full revenue picture of a mammography program across a multi-year horizon -- from base screening through diagnostic workup, biopsy, detection, and treatment -- with cited defaults and every assumption adjustable.
In this article
Why this tool exists
A screening mammogram rarely ends the encounter. It begins one. A fraction of screened women are recalled, a fraction of those proceed to diagnostic imaging, a smaller fraction to biopsy, and a smaller fraction still to a cancer diagnosis and treatment. Each step carries its own volume, its own reimbursement, and its own clinical weight. Program leaders intuit that this cascade is where much of the value sits, yet few can put a defensible number on it.
The Downstream Revenue Estimator, developed by Mammologix (powered by I/O Trak, Inc.), exists to make that number visible, honest, and adjustable. It models the full revenue picture of a mammography program across a multi-year horizon, from the base screening exam through diagnostic workup, biopsy, detection, and (optionally) treatment. It ships with cited defaults, and it exposes every meaningful assumption for the user to change.
This article documents how the tool is built, the evidence beneath each default, the quality checks it survived, and, most important, the boundaries within which it should be trusted. Transparency is not a courtesy here. It is the condition under which a planning estimate earns a place in a serious financial conversation.
The problem with the obvious approach
The intuitive method is to take the published national figures on breast imaging utilization and multiply. That method produces numbers that are wrong by a wide margin, and the error is instructive.
The most cited source in this space reports that among patients who entered the diagnostic pathway, 53.3% received diagnostic mammography, 42.4% received ultrasound, and 10.3% underwent biopsy.1 A tempting shortcut applies those percentages to every screened woman. Doing so implies a biopsy rate five to seven times higher than reality, because those percentages describe the diagnostic pathway population, not the screened population. The denominator is the entire point, and the shortcut gets it wrong.
Any credible model must therefore separate the base population from the pathway population, and must apply each published rate only to the cohort it was measured against. That single discipline drives the architecture described below.
Architecture: three mutually exclusive tiers
The estimator reports revenue in three tiers that never overlap. The separation is deliberate, because a program that is 100% screening and a program that runs a 50/50 screening-to-diagnostic mix generate revenue through different channels, and a single blended figure would misstate both.
Tier 1, the screening base. Every screening patient generates one screening mammogram. This is base exam volume, not downstream activity.
Tier 2, the diagnostic referral base. Every diagnostic referral generates one guaranteed index diagnostic mammogram. At a pure screening facility this tier is exactly zero. At a diagnostic-heavy breast center it can be substantial.
Tier 3, the downstream cascade. This is the true downstream figure: the additional workup generated by recalled screening patients and by diagnostic referrals. Recalled screening patients flow through the full published utilization pattern. Diagnostic referrals, having already been credited their index exam in Tier 2, contribute only the workup beyond that index exam. This prevents double counting in either direction and keeps the model coherent at any program mix.
Utilization within the cascade follows a MarketScan claims analysis of 875,526 patients projected nationally.1 Among pathway patients, that analysis found diagnostic mammography in 53.3% at 1.32 exams each, ultrasound in 42.4% at 1.33 exams each, and biopsy in 10.3% at 1.24 procedures each.1 The per-patient intensity factors (1.32, 1.33, and 1.24) are derived directly from the procedure-to-patient ratios published in the Vlahiotis utilization tables and supporting text, not assumed.1 These rates are editable, so a facility with its own audit data can override the national pattern entirely.
Two populations, two detection rates
Cancer detection is where a naive model fails a clinician's scrutiny fastest. Screening and diagnostic populations do not detect cancer at the same rate, and treating them as one understates the diagnostic contribution severely.
The estimator applies two separate rates. Screening volume uses a cancer detection rate defaulting to 4.5 per 1,000, a conservative figure against the Breast Cancer Surveillance Consortium (BCSC) screening benchmark of 5.1 per 1,000.2 By audit convention, this rate already accounts for cancers found through recall workup, so no double count arises with the cascade.
Diagnostic referral volume uses a distinct rate defaulting to 34.7 per 1,000, the BCSC diagnostic benchmark drawn from 401,548 diagnostic examinations among 265,360 women across six registries.3 The 95% confidence interval is 34.1 to 35.2.3 This rate varies widely by indication and reaches 64.5 per 1,000 when the exam evaluates a palpable lump.3 The field carries that guidance, so a symptom-heavy referral practice can raise the input toward its true experience.
The effect is not cosmetic. At default settings the diagnostic population represents a small share of program volume yet contributes the majority of detected cancers, because its detection rate runs several times higher than screening. That finding is not a modeling artifact. It reflects the clinical reality that symptomatic and recalled patients are enriched for disease.
The treatment module and stage stratification
Treatment revenue is the largest and most sensitive component, and the tool treats it accordingly. It is a separate module, and every figure it produces is a blended average, weighted across stage at detection rather than predicted per case.
Per-stage costs use published 24-month allowed costs from a commercial claims analysis:4 stage 0 at $71,909, stage I/II at $97,066, stage III at $159,442, and stage IV at $182,655, all in 2010 dollars. Each detection population carries its own editable stage mix, anchored to BCSC early-stage shares, which run higher for screen-detected disease than for diagnostically detected disease. Because dx-detected cancers skew later, their blended average per case exceeds the screen-detected average, and the model reflects that shift explicitly.
Two adjustment levers guard against overstatement. An inflation adjustment acknowledges that the source figures are 2010 dollars. A system capture rate acknowledges that these are payer allowed costs across all sites of care (surgery, medical oncology, radiation, inpatient), not facility net revenue. Both default to 100%, so the tool never silently inflates a published number. The interface labels every treatment cost field as a blended average and displays the computed weighted average per cancer as the user types, so the assumption is never hidden behind the result.
The reimbursement basis
All reimbursement defaults reflect 2026 national average Medicare rates, verified against the CY 2026 Medicare Physician Fee Schedule Final Rule5 and the CY 2026 Hospital Outpatient and Ambulatory Surgical Center Final Rule.6 Mammography defaults derive from current-year CPT and HCPCS values at the published conversion factor. Image-guided biopsy offers three site-of-service presets, from physician office through ambulatory surgical center to hospital outpatient department, because payment for that procedure varies by a factor of nearly four across settings.
The tool defaults to the office rate, the most conservative choice, and requires a deliberate selection to model the hospital outpatient premium. A payer blend adjustment lets the user scale all imaging revenue above the Medicare floor, since commercial contracts commonly pay well beyond it. The methodology notes also flag the direction of policy travel: site-neutral payment continues to expand, so projections built on hospital outpatient rates should be read as a ceiling rather than a floor.
Quality checks and validations
A planning tool that touches revenue and clinical outcomes is Your-Money-or-Your-Life content, and it was tested against that standard, not a lighter one.
Arithmetic reconciliation. On every table row and on the totals row, the four revenue tiers sum exactly to the reported total. Each hero band reconciles the same way: base plus downstream equals total program; treatment plus workup equals total downstream; and the year-one components sum to the year-one total. These identities were verified across 420 configurations spanning every screening mix, one-to-ten-year horizons, and both treatment states, with zero failures.
Displayed-part integrity. When a total is split for display, the parts must sum to the whole. A largest-remainder allocation guarantees that the screen-detected and diagnostic-detected counts always add to the headline cancer figure, rather than showing a breakdown that visibly fails its own arithmetic. This was fuzz-tested across 1,617 parameter combinations without a single inconsistency.
Edge-case behavior. At a 100% screening mix, the diagnostic tier collapses to zero, as it must. Growth and retention inputs reproduce their expected volumes exactly.
Source integrity. Every load-bearing constant was verified against its primary source, and an automated check confirms that each cited figure appears correctly in the methodology record before release. Where a rate could not be verified to a primary source, it was not entered. During development one set of indication-specific detection rates was retracted before publication precisely because it had not been confirmed against the source table.
Citation discipline. No numeric constant may change without a matching change to the methodology footer, because a stale citation is a false statement in YMYL content, not a formatting oversight.
How this tool should be used, and how it should not
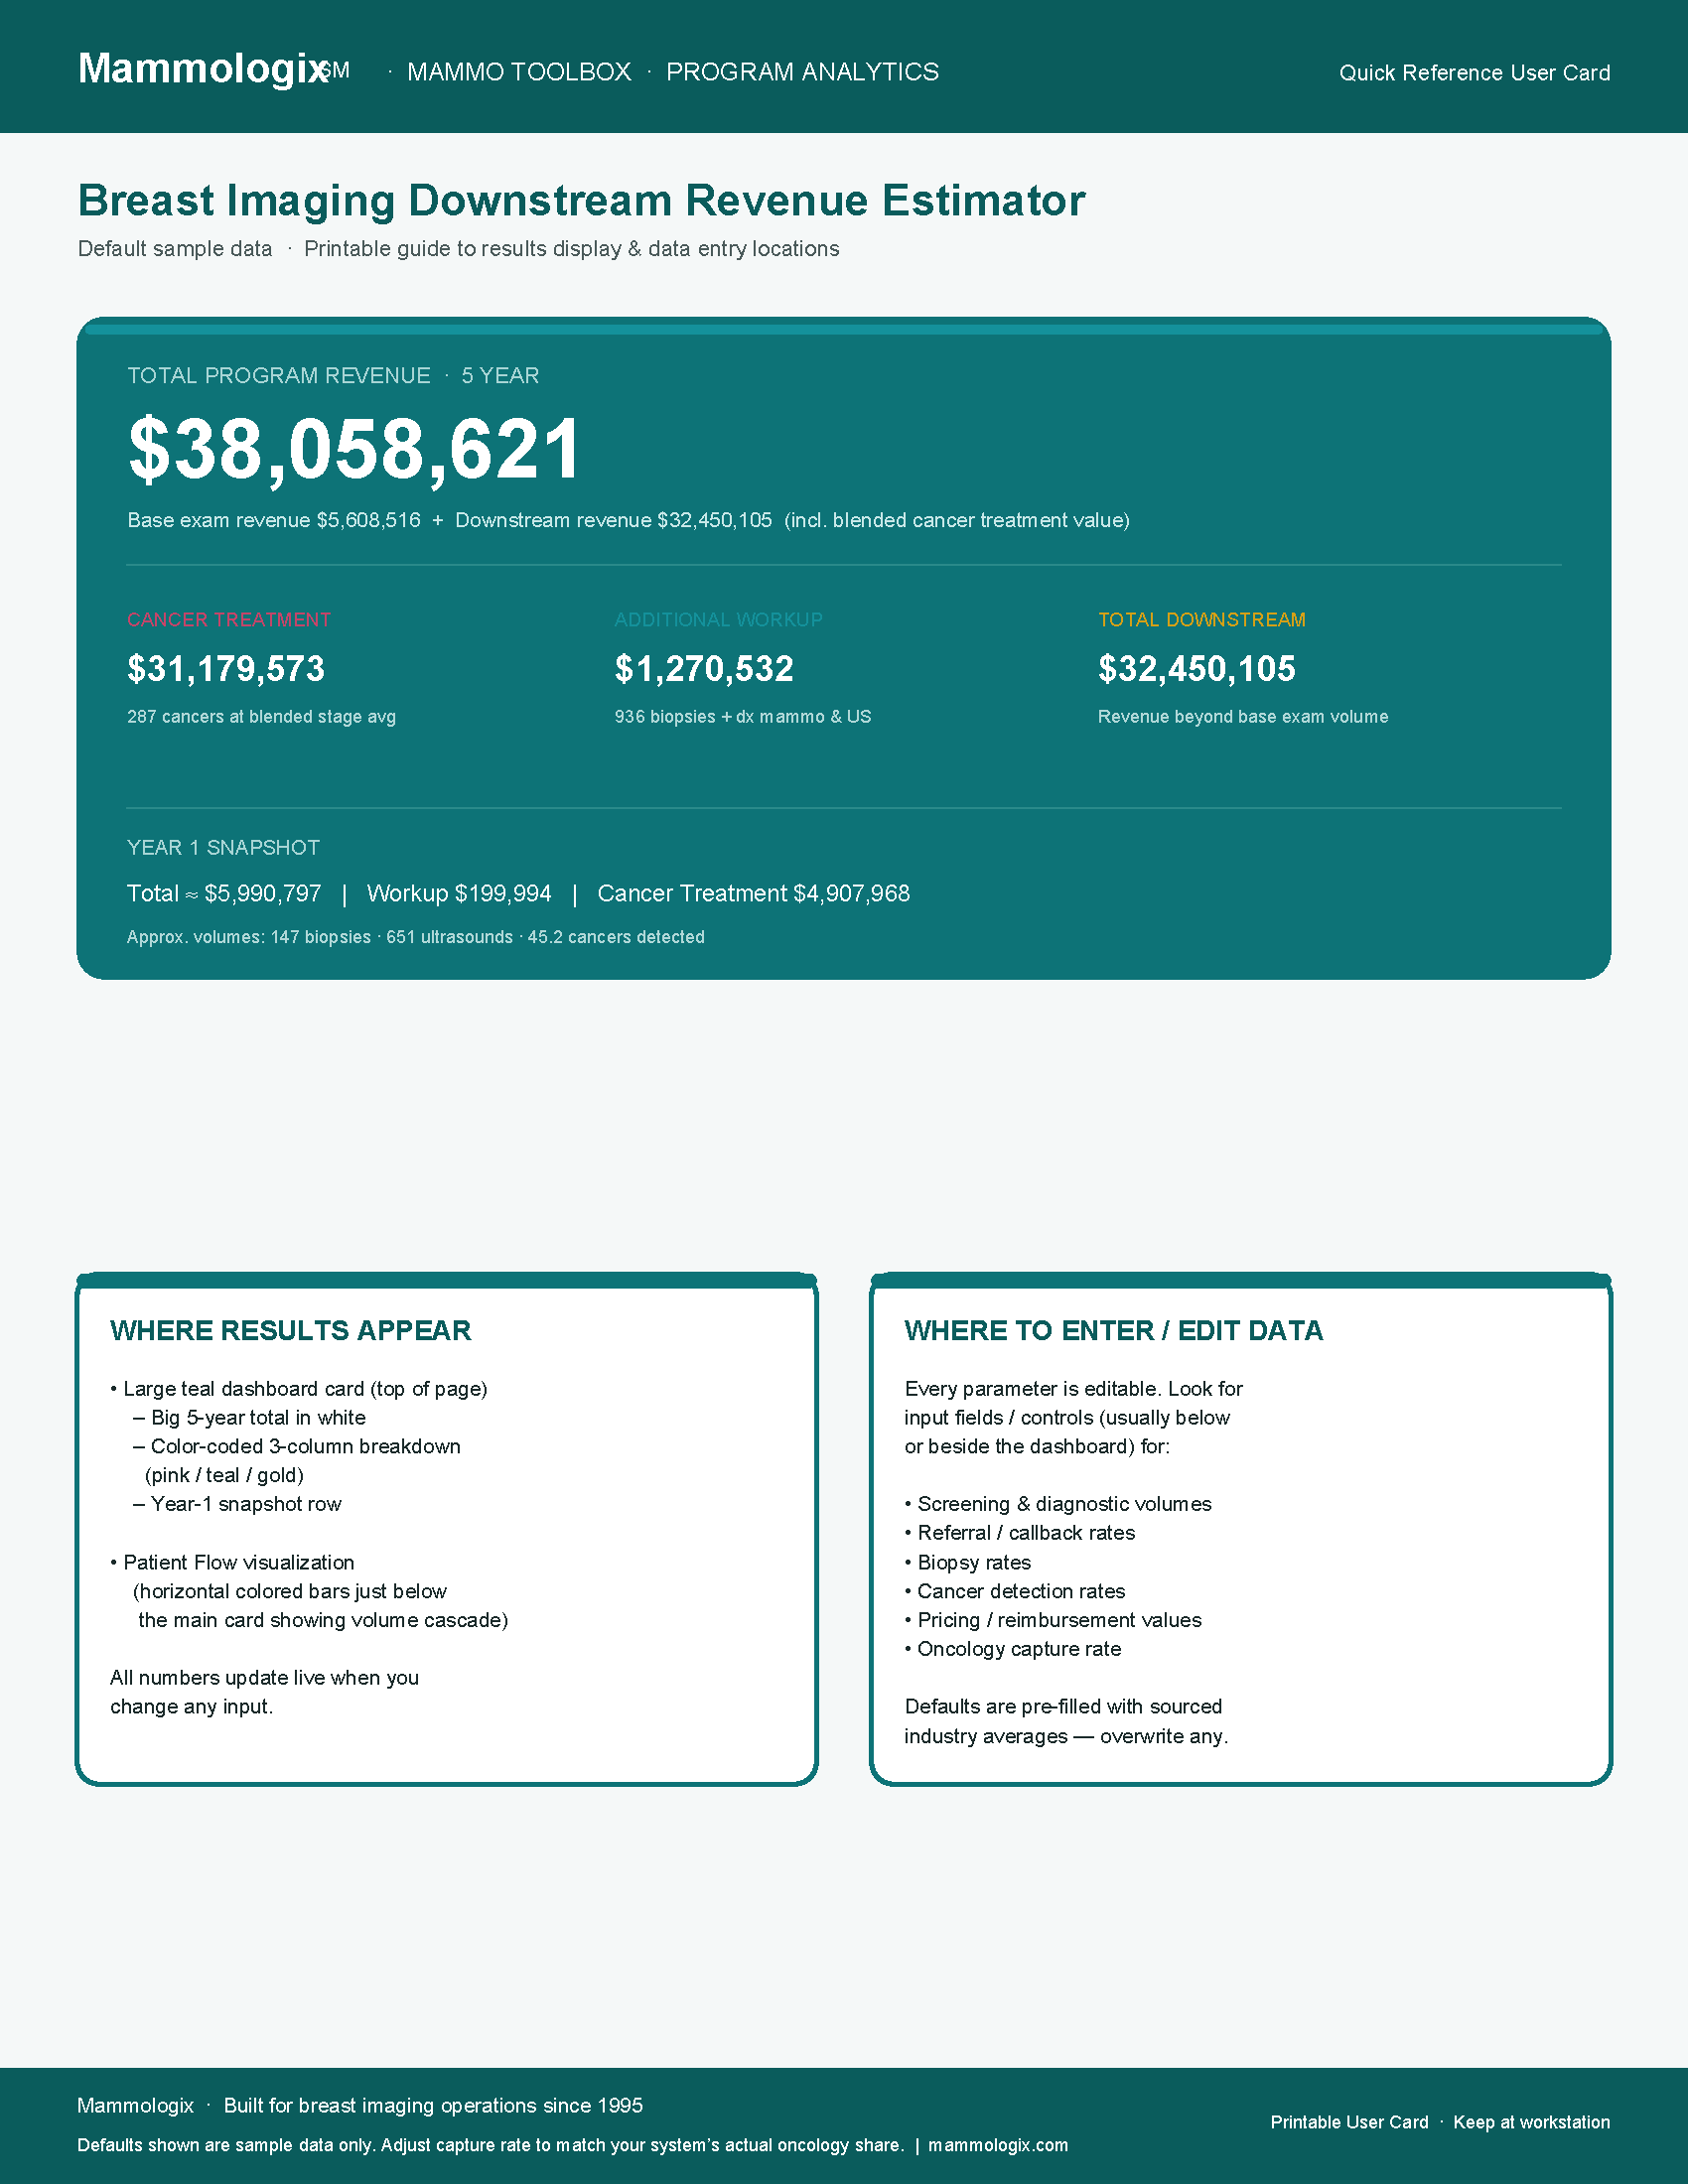
The estimator is a planning instrument for facility and program leadership. It is not billing guidance, coding guidance, reimbursement guidance, legal advice, or clinical advice, and it is not built for patient use or patient health decisions.
Three cautions deserve emphasis. First, the default stage mixes are national planning assumptions; a facility should replace them with its own audit data before presenting the treatment figure to finance leadership. Second, treatment values are payer allowed costs across all sites of care, so the headline treatment number will exceed facility net revenue unless the capture rate is set to the system's true oncology share. Third, actual payment varies by locality, payer contract, site of service, and coding, so every figure is an estimate bounded by the quality of its inputs.
Used within those boundaries, the tool does something a spreadsheet of national averages cannot. It shows, transparently and reconcilably, how a small diagnostic population can dominate both the clinical yield and the economic case for a breast imaging program.
Development, provenance, and community intent
This estimator was developed by Mammologix (powered by I/O Trak, Inc.), built on decades of hands-on work with breast imaging facilities across the eastern, southeastern, and southwestern United States. That work is the tool's real foundation. For more than thirty years, Mammologix has compiled mammography medical outcome audits (MMOA), reconciled facility data against national benchmarks, and translated raw audit output into the performance picture that program leadership actually uses.
That experience shaped every design choice above. Three examples stand out: the separation of the screened population from the diagnostic pathway, the two-population detection logic, and the refusal to let a blended average pose as a per-case prediction. Each reflects a pattern seen repeatedly in real facility data, not a theoretical preference. Facilities consistently ask the same question in different words. What is the full value of the program we run, and how do we express it in terms our own finance leaders will accept? The estimator is one answer, offered in a form any facility can use.
The community intent is deliberate. Every facility that performs mammography already generates the inputs this tool needs. The annual MMOA compiled for Mammography Quality Standards Act (MQSA) inspection holds a facility's own recall rate, cancer detection rate, positive predictive values, and stage distribution at detection. Internal quality improvement analyses hold the rest. The estimator is designed to receive exactly those numbers.
A facility does not have to accept the national defaults. It should not. Exposing every parameter lets a program replace the benchmark with its own audited experience, one field at a time. A facility can enter its measured recall rate, its own screening and diagnostic detection rates, its documented stage mix, and its contracted payer rates, then read back an estimate grounded entirely in its own data. The peer-reviewed defaults are a starting point and a sanity check, not a substitute for a facility's audit.
There is a larger aim in offering the tool this way. Breast imaging programs across the country perform the same downstream-value calculation privately, inconsistently, and often incorrectly, each reinventing a flawed method behind its own closed door. A shared instrument, built on peer-reviewed data, reconciled arithmetic, and transparent assumptions, lets the whole community perform the calculation the same way and defend it the same way. Comparable numbers are the ones that change decisions.
Which raises the question every program should be prepared to answer: if the greatest share of downstream value flows through the patients most likely to be lost between exams, what is a program's plan to keep them from slipping through?
Disclaimer: The views expressed in this article are those of the author and do not constitute medical, legal, or regulatory advice. Facilities should consult their own compliance, legal, and clinical leadership before acting on anything discussed here. Patients should not rely on this content for personal health decisions and should discuss their screening, diagnostic, and follow-up care directly with their own physician or care team.
About the Author
Richard D. Lippert, Jr. is the Founder, President, and Chief Executive Auditor of Mammologix and has supported breast imaging centers with mammography medical outcome audits, downstream revenue analysis, and operational strategy since 1995.
References
Vlahiotis A, Griffin B, Stavros AT, Margolis J. Analysis of utilization patterns and associated costs of the breast imaging and diagnostic procedures after screening mammography. Clinicoecon Outcomes Res. 2018;10:157-167. doi:10.2147/CEOR.S150260. PMID 29618934. PMCID PMC5875586.
Lehman CD, Arao RF, Sprague BL, et al. National performance benchmarks for modern screening digital mammography: update from the Breast Cancer Surveillance Consortium. Radiology. 2017;283(1):49-58. doi:10.1148/radiol.2016161174. PMID 27918707.
Sprague BL, Arao RF, Miglioretti DL, et al. National performance benchmarks for modern diagnostic digital mammography: update from the Breast Cancer Surveillance Consortium. Radiology. 2017;283(1):59-69. doi:10.1148/radiol.2017161519. PMID 28244803.
Blumen H, Fitch K, Polkus V. Comparison of treatment costs for breast cancer, by tumor stage and type of service. Am Health Drug Benefits. 2016;9(1):23-32. PMID 27066193. PMCID PMC4822976.
Centers for Medicare and Medicaid Services. Medicare and Medicaid Programs; CY 2026 Payment Policies Under the Physician Fee Schedule and Other Changes to Part B Payment and Coverage Policies; Final Rule (CMS-1832-F). Addendum B, national payment amounts. Baltimore, MD: CMS; 2025.
Centers for Medicare and Medicaid Services. Medicare Program; CY 2026 Hospital Outpatient Prospective Payment System and Ambulatory Surgical Center Payment System; Final Rule (CMS-1834-FC). Addendum B and ASC addenda. Baltimore, MD: CMS; 2025.
Methods note and reproducibility
A companion methods note, published alongside this article, documents the three-tier arithmetic identities, the two-population detection logic, the treatment blending formula, and the complete validation matrix (the 420-configuration band reconciliation and the 1,617-configuration allocation fuzz test). It is provided so that any reader can reproduce the model's arithmetic independently from the published formulas, rather than taking the internal validation counts on faith. See "Downstream Revenue Estimator: Methods and Validation Note."
About the Author
Richard D. Lippert, Jr.
Founder, President, and Chief Executive Auditor, Mammologix · Breast Imaging Operations since 1995
Founder of Mammologix, Richard D. Lippert, Jr. has spent more than 30 years in breast imaging operations, from clinical practice and hospital radiology administration to building specialized service platforms for imaging centers nationwide. His work spans mammography tracking, lay communication, FDA/MQSA-related support, medical outcome audit, and the operational systems that help facilities stay compliant and keep patients from falling through the cracks.
Full credentials and background →Keep Reading
Related Resources
Downstream Revenue Estimator: Methods and Validation Note
A complete, reproducible documentation of the Downstream Revenue Estimator's arithmetic: the three-tier revenue formulas, two-population detection logic, treatment blending, largest-remainder display rounding, a worked year-1 example, and the full 420-configuration validation matrix.
Protecting the Standard of Care: A Regulatory Risk Analysis of U.S. Breast Cancer Screening Infrastructure in 2026
A regulatory risk analysis of four convergent threats to U.S. breast cancer screening infrastructure in 2026 , USPSTF administrative disruption, MQSA enforcement continuity, the anti-over-medicalization cultural narrative, and their cascade interaction , with institutional response recommendations for breast imaging program leadership.
How the Supreme Court Just Saved Mammograms
Breast cancer remains the second leading cause of cancer death among women in the United States, despite significant advances in early detection and treatment.
See how Mammologix puts this into practice
Real operational support for breast imaging centers.